Case Study: How a Solar Website Went From 6 to 800+ Visitors a Month From Google
The business: a solar panel website with an online store and partner installers, in Romania. It is my own project, so every number below is real and I can show where it comes from.
The period: January to November 2026
Where the numbers come from: Google Search Console (Google’s own report of how often a site shows up and gets clicked), Google Analytics (who visits and what they do) and the website’s inbox. Pulled on 31 October and 12 November 2026.
In short
| January 2026 | September 2026 | |
|---|---|---|
| People who clicked through to the site from Google, per month | 6 | 843 |
| Times the site showed up in Google results, per month | 1,358 | 41,326 |
| Where the site usually appeared in Google | page 3 | page 1 |
- 163 quote requests from homeowners came through the website forms from May to October 2026.
- 3,853 different searches brought people to the site between May and October.
- Before May, the forms brought 2 to 3 requests a month. From May to October: 20 to 41 a month.
Month by month
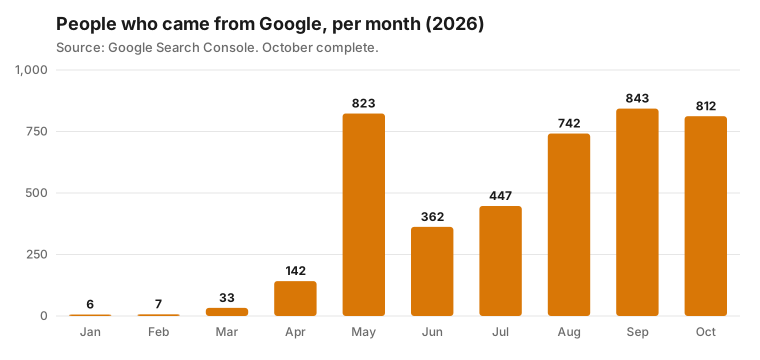
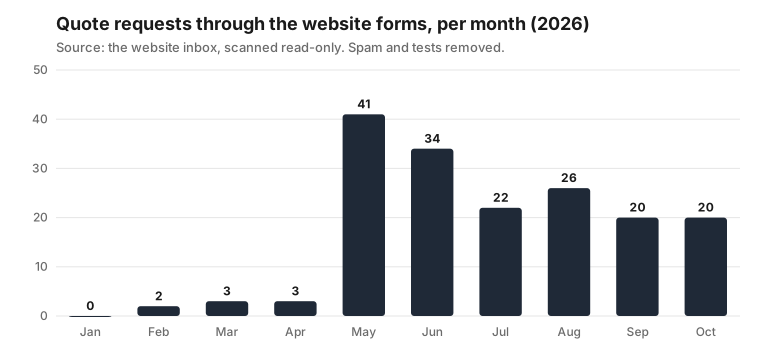
| Month (2026) | Clicks from Google | Visits from Google search (Google Analytics) | Requests through the website forms |
|---|---|---|---|
| January | 6 | 18 | 0 |
| February | 7 | 26 | 2 |
| March | 33 | 73 | 3 |
| April | 142 | 234 | 3 |
| May | 823 | 1,124 | 41 |
| June | 362 | 465 | 34 |
| July | 447 | 431 | 22 |
| August | 742 | 514 | 26 |
| September | 843 | 620 | 20 |
| October | 812 | 536 | 20 |
Google Search Console and Google Analytics count in different ways, so their numbers never match exactly. What matters is the direction: from almost nothing to hundreds of visitors and dozens of requests a month.
Screenshots from the real accounts

Google Search Console, January to October 2026. Blue: clicks. Purple: how often the site showed up in Google. Flat until April, then the line goes up and stays up.
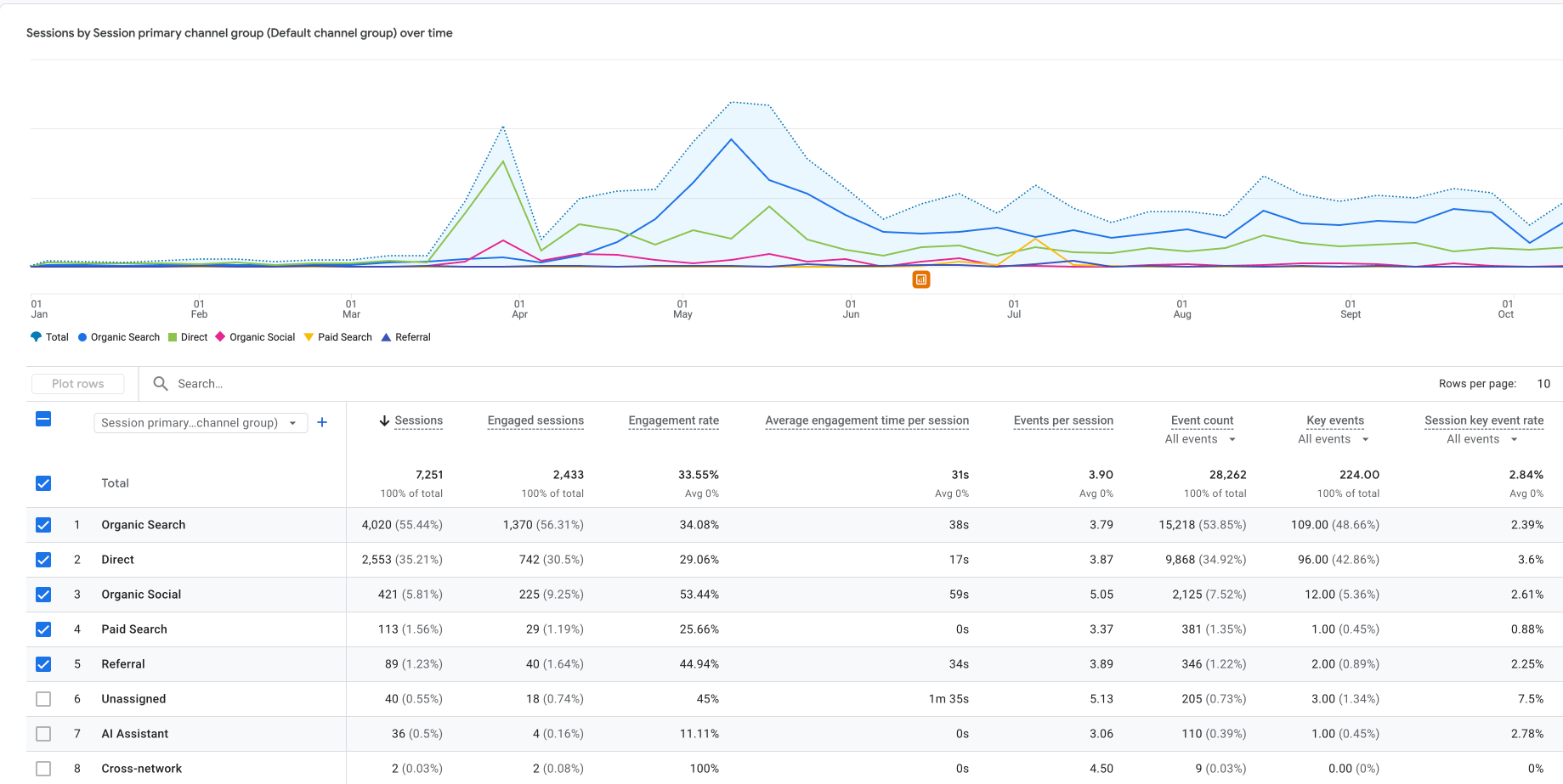
Google Analytics, January to October 2026. “Organic Search” means people who came from Google or Bing without ads: 4,020 visits, more than half of all visits, and 109 form requests (“Key events”). Screenshot taken in November 2026, so the totals are a few days ahead of the table above.
Where the requests came from
Most requests did not come from blog articles. They came from tools that help a homeowner decide:
| Tool on the website | Visitors from Google, May to October | Quote requests |
|---|---|---|
| Checker: “Do I qualify for the national solar grant?” | 712 | 78 |
| Cost calculator: “How much would a system cost me?” | 173 | 22 |
| Guide: “Which EU funds can pay for my panels?” | 90 | 19 |
The 22 homeowners who used the cost calculator priced projects worth 696,400 to 934,800 lei in total, about €130,000 to €175,000 (ECB rate of 30 October 2026). These are quote requests, not signed contracts, but they show the size of the work that came in through one page.
Of the 78 grant-checker requests, 31 were from homeowners with a suitable roof who wanted to install within 3 months.
This is what the two best tools look like on the website (in Romanian, for Romanian homeowners):
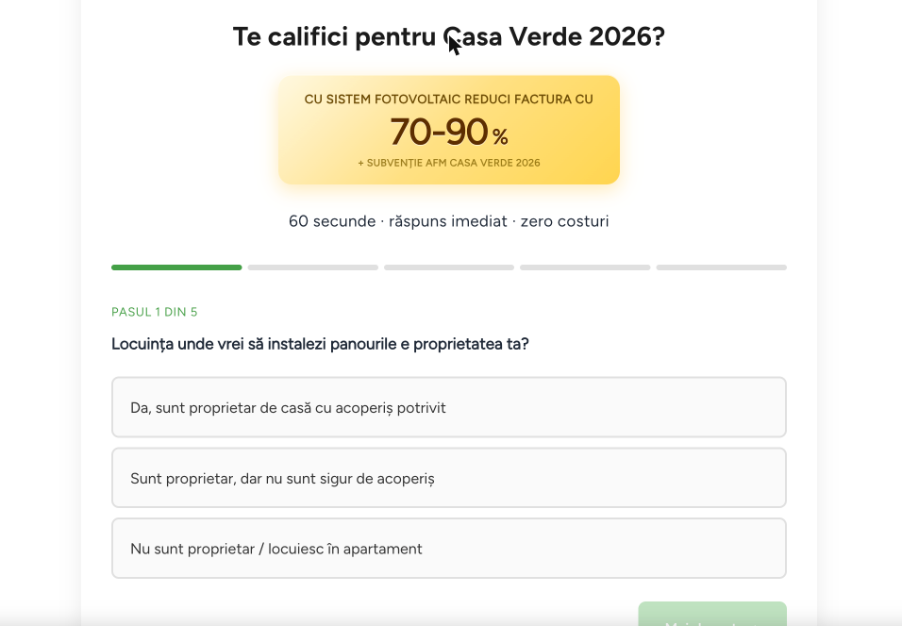
The grant checker: 5 short questions (“Is the house yours? Is the roof suitable?”), an answer in 60 seconds, then the homeowner leaves their details.
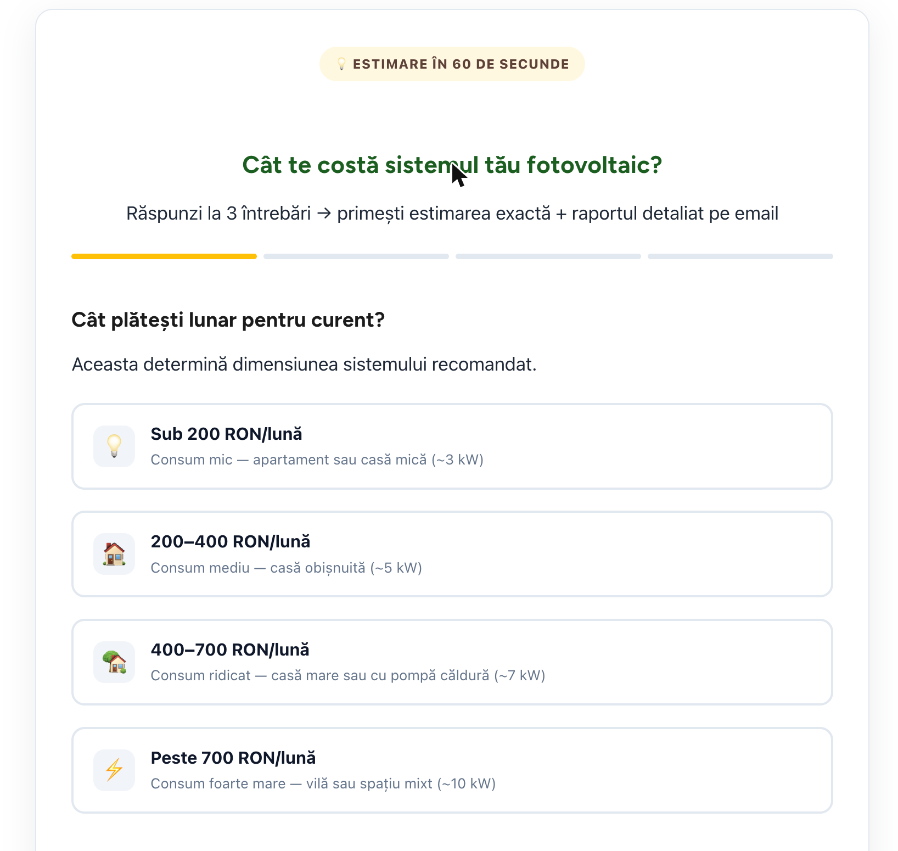
The cost calculator: 3 questions, starting with the monthly electricity bill, then the estimate and a detailed report by email.
Every market has its own version of these tools: a grant, a tax credit, a payment for the power you send back to the grid.
Which websites sent the visitors
From 1 January to 12 November 2026 (Google Analytics):
| Source | Visits | Quote requests |
|---|---|---|
| 3,237 | 102 | |
| Bing | 874 | 12 |
| Reddit (the community, see below) | 364 | 12 |
| ChatGPT | 57 | 3 |
ChatGPT is small today, but it already sends people who ask for quotes. AI assistants mostly recommend websites that already show up well on Google, so the work on Google pays off twice.
What I built
1. Pages that answer homeowners’ real questions. How much a system costs, which grant they qualify for, whether a battery is worth it, how long the system takes to pay back. Each page answers one question in plain words.
2. Tools that turn a visitor into a request. The grant checker, the cost calculator and the funding guide above. A homeowner gets an answer for their own house, then asks for a quote.
3. A community. A solar discussion group on Reddit that had been inactive for years. With one post a day, it grew from about 880 to about 11,700 visitors a month and 2,420 members. In the comments I found 59 people who were clearly ready to buy. It also went wrong in public, and that part taught me the most (see below).
4. Quotes in minutes, not hours. A quote used to take hours. Now the system prepares it in under a minute, I check it in about 2 minutes, and it goes out as a PDF. Every price comes from a real price list and a real installer invoice.
5. Requests that reach the installer the way installers work. Installers are on roofs all day. Every request goes to them as a short email seconds after the form is filled, with one button that opens WhatsApp with the homeowner. Every morning at 9 they get one reminder: who is new, who is still waiting. No app, no login. On my side, every request sits in one tracker, and a request turns red if nobody has called the homeowner within 2 days.
6. An alarm when the website stops working. Once, an automatic update broke the site for 3 days before anyone noticed. Now a check runs every 5 minutes and sends me a phone alert within 10 minutes.
The community: what worked and what went wrong
The discussion group is the most honest part of this story, so here it is in full.
What worked. An automatic post every morning at 10 turned a dead group into a busy one:
| Before (January to February 2026) | After (April to September 2026) | |
|---|---|---|
| Visitors per month | about 880 | about 11,700 |
| Members | inactive | 2,420 |
| Comments from homeowners | almost none | 674 |
From 1 January to 12 November, the group sent 364 visits and 12 quote requests to the website (Google Analytics).
What went wrong. By September, most members were voting the posts down, and the most liked comment in the group asked us to stop the bot. I expected them to complain about the writing style. They did not. Every serious complaint was about a wrong number:
- A battery price was published at about double the real price. A member replied with a link to a shop selling it for half.
- The price of electricity in the posts was older and lower than what people were paying.
- A post written for spring went out in August.
These people had just paid real prices for their own systems. A text that sounds like AI, they forgave. A wrong price, they did not.
The second mistake: nobody answered. 674 comments came in, and in six months only 1 got a reply. One homeowner asked the same question twice, in April and in July, about batteries that were too expensive for their system. It became the most liked comment in the group. Nobody answered it, while the website was selling exactly that kind of battery.
What I changed:
- A fact check before anything is published. Every price and number needs a source and a date. If it has no source or is older than 90 days, the post is blocked. On the first run it stopped 5 of 13 waiting posts, exactly the ones with the wrong numbers.
- Prices come from the real price list, not from memory.
- Fewer posts: from every day to twice a week.
- The comments became research. I sorted all 674: 168 were about batteries, 132 about inverters, 41 were complaints about installers or warranties. That told me what to write on the website and which homeowners were ready to buy (the 59 above).
The lesson for an installer: automation can bring people, but it cannot earn their trust on its own. A wrong price costs more than no post at all, and a question nobody answers is a lost job.
What did not work, and what I learned
- Requests went down after the May peak, from 41 in May to about 20 a month in September and October. The steady level after May is the more realistic number to plan with.
- The community pushed back. Automated posts quoted wrong prices and nobody answered the comments (full story above). Since then, every number is checked against a source before it is published.
- Requests are not sales. The numbers on this page are homeowners asking for a quote. How many sign depends on the installer’s offer and follow-up.
What this means for your company
- Homeowners search before they call. They ask Google, and more and more ChatGPT, about costs, grants and batteries. The installer whose website answers those questions gets the call.
- One good tool beats ten blog posts. A cost calculator or a grant checker for your area can bring more requests than any article.
- Speed wins the job. A homeowner who gets a quote the same day is less likely to keep shopping.
Want the same for your company?
I start with an AI Search Visibility Audit (€750): where your company shows up on Google and in ChatGPT today, what your competitors do better, and a 90-day plan. If you continue with monthly work, the €750 is credited to your first month.